
A collaborative team led by Professor Tian Hao and Associate Professor Peng Tan from the School of Physics at the Harbin Institute of Technology (HIT), working with Professor Fei Li of Xi’an Jiaotong University and Professor Shujun Zhang of the University of Wollongong, Australia, has made a breakthrough in understanding how transition metal doping tailors piezoelectric properties in perovskite ferroelectrics. Their study, titled Deciphering the Atomistic Mechanism Underlying Highly Tunable Piezoelectric Properties in Perovskite Ferroelectrics via Transition Metal Doping, was published in Nature Communications. Using iron- and manganese-doped potassium tantalate niobate (KTN) single crystals, the team revealed how doping modulates intrinsic polarization and piezoelectric performance, offering a blueprint for strategic design of advanced ferroelectric materials.
Piezoelectricity—a key property of perovskite ferroelectrics—makes these materials vital for macro- to nanoscale electromechanical systems. While defect engineering strategies, such as trace transition metal doping, show promise in tuning piezoelectric responses, the atomic-scale mechanisms remain poorly understood. Previous studies often attributed performance changes to domain wall motion, overlooking the distinct roles of dopant elements. For instance, iron and manganese, both acceptor dopants, yield starkly different outcomes: manganese enhances piezoelectric coefficients, while iron improves mechanical stability.
To resolve this paradox, the team studied orthorhombic KTN crystals doped with iron or manganese. They discovered that despite similar doping mechanisms, the electronic configurations of these metals differentially regulate lattice distortion, spontaneous polarization orientation, and local charge distribution:
1. Manganese doping disrupts polarization continuity, inducing localized distortions that boost the piezoelectric coefficient to over 1,000 pC/N—double that of pure KTN.
2. Iron doping enhances polarization order, causing a “hardening” effect that elevates the mechanical quality factor to 700, fivefold higher than pure KTN.
This contrast highlights the potential of tailored transition metal doping to achieve multifunctional modifications in perovskite ferroelectrics. By strategically selecting dopants and engineering defect dipoles, researchers can design materials optimized for specific applications, from high-precision sensors to robust energy harvesters.
Paper link: https://doi.org/10.1038/s41467-024-54842-6
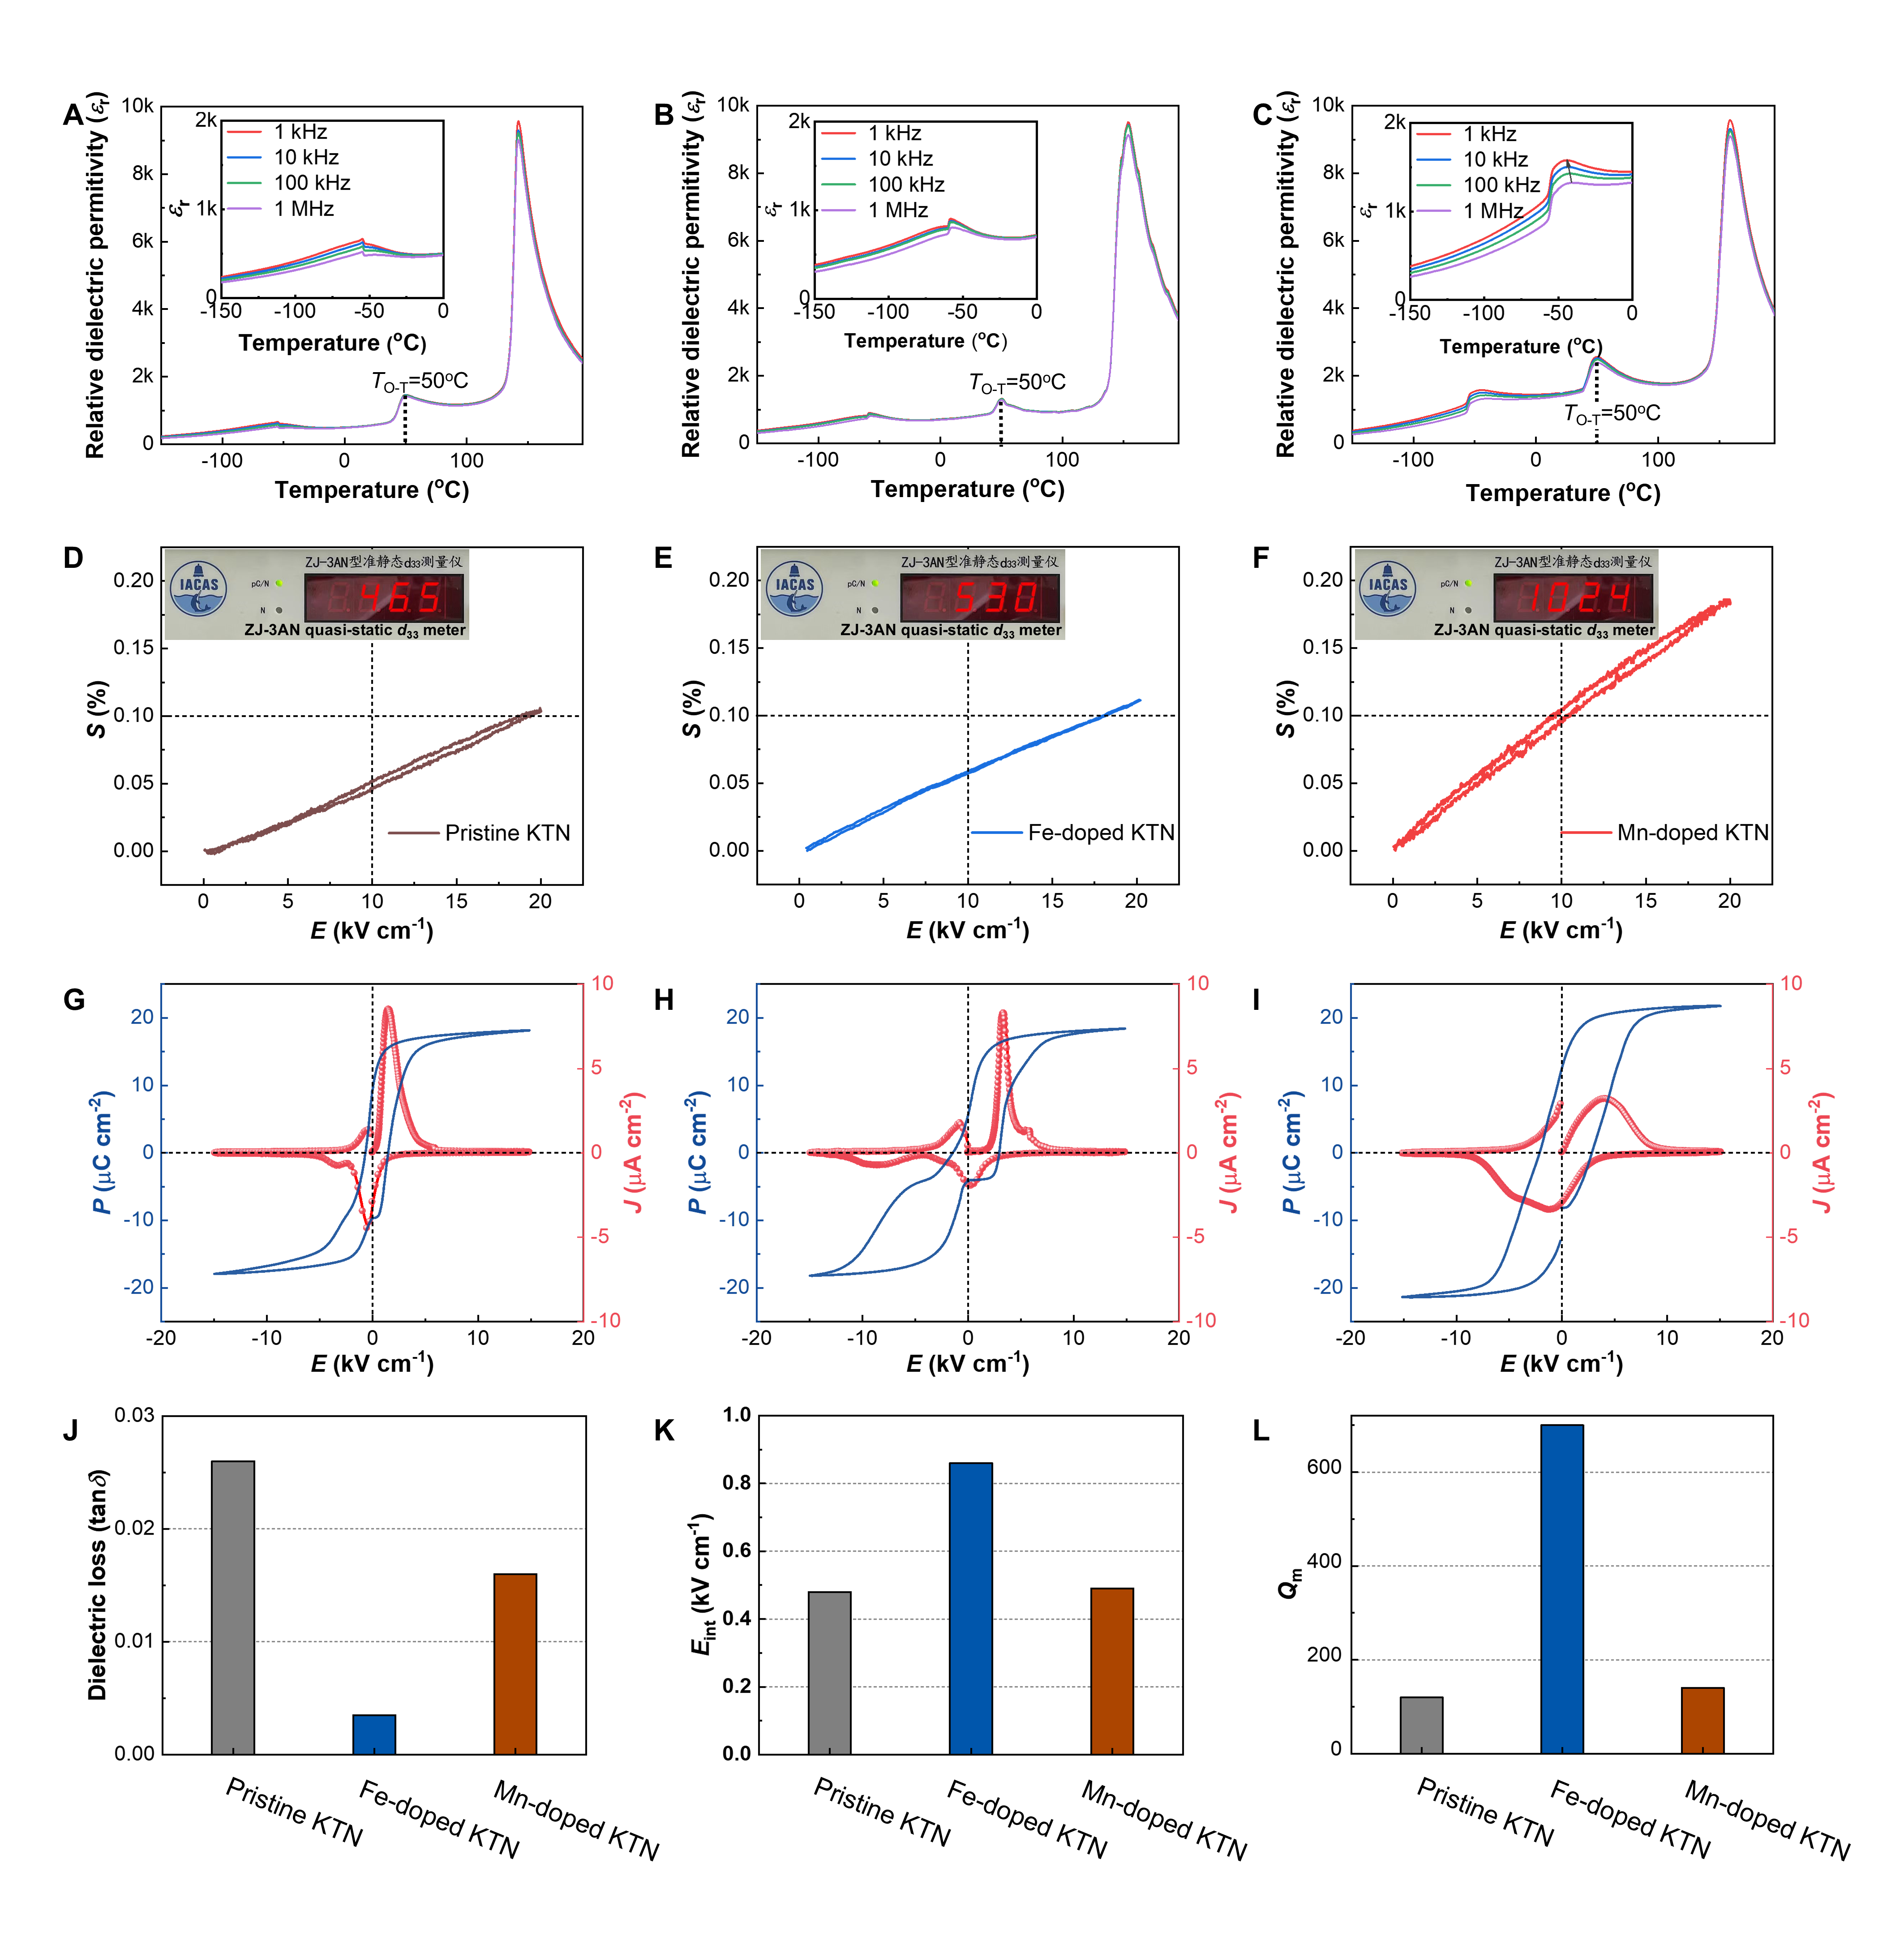
Fig. 1 | Comparison of the various properties for pristine, Fe-doped, and Mn-doped KTN crystals. A–C Dielectric constant εr as a function of temperature and frequency, D–F strain–electric field (S–E) loops at 1 Hz, G–I polarization–electric field (P–E) loops, current–electric field (J–E) loops at 1 Hz, J dielectric losses tan δ at 100 kHz, K internal bias fields, Eint, extracted from P–E loops, and L lateral-mode mechanical quality factors, Qm, for pristine, Fe-doped, and Mn-doped KTN crystals, respectively. The orthorhombic–tetragonal phase transition temperatures of 50 °C are marked in (A–C), and the insets show the corresponding low-temperature dielectric properties in the range of −150 to 0 °C. The arrow in (C) inset indicates a frequency dependence of dielectric maxima at the rhombohedral-to-orthorhombic phase transition, showing a typical relaxor behavior. The insets in (D–F) are the photos giving the results of quasi-static d33 tests. In the S–E, P–E, and Qm measurements, the samples poled along the [001]C crystallographic direction were used. The magnitude of Eint is determined by Eint = (E+ + E−)/2, where E+ and E− are the intersections of polarization loop with positive and negative electric field axis.
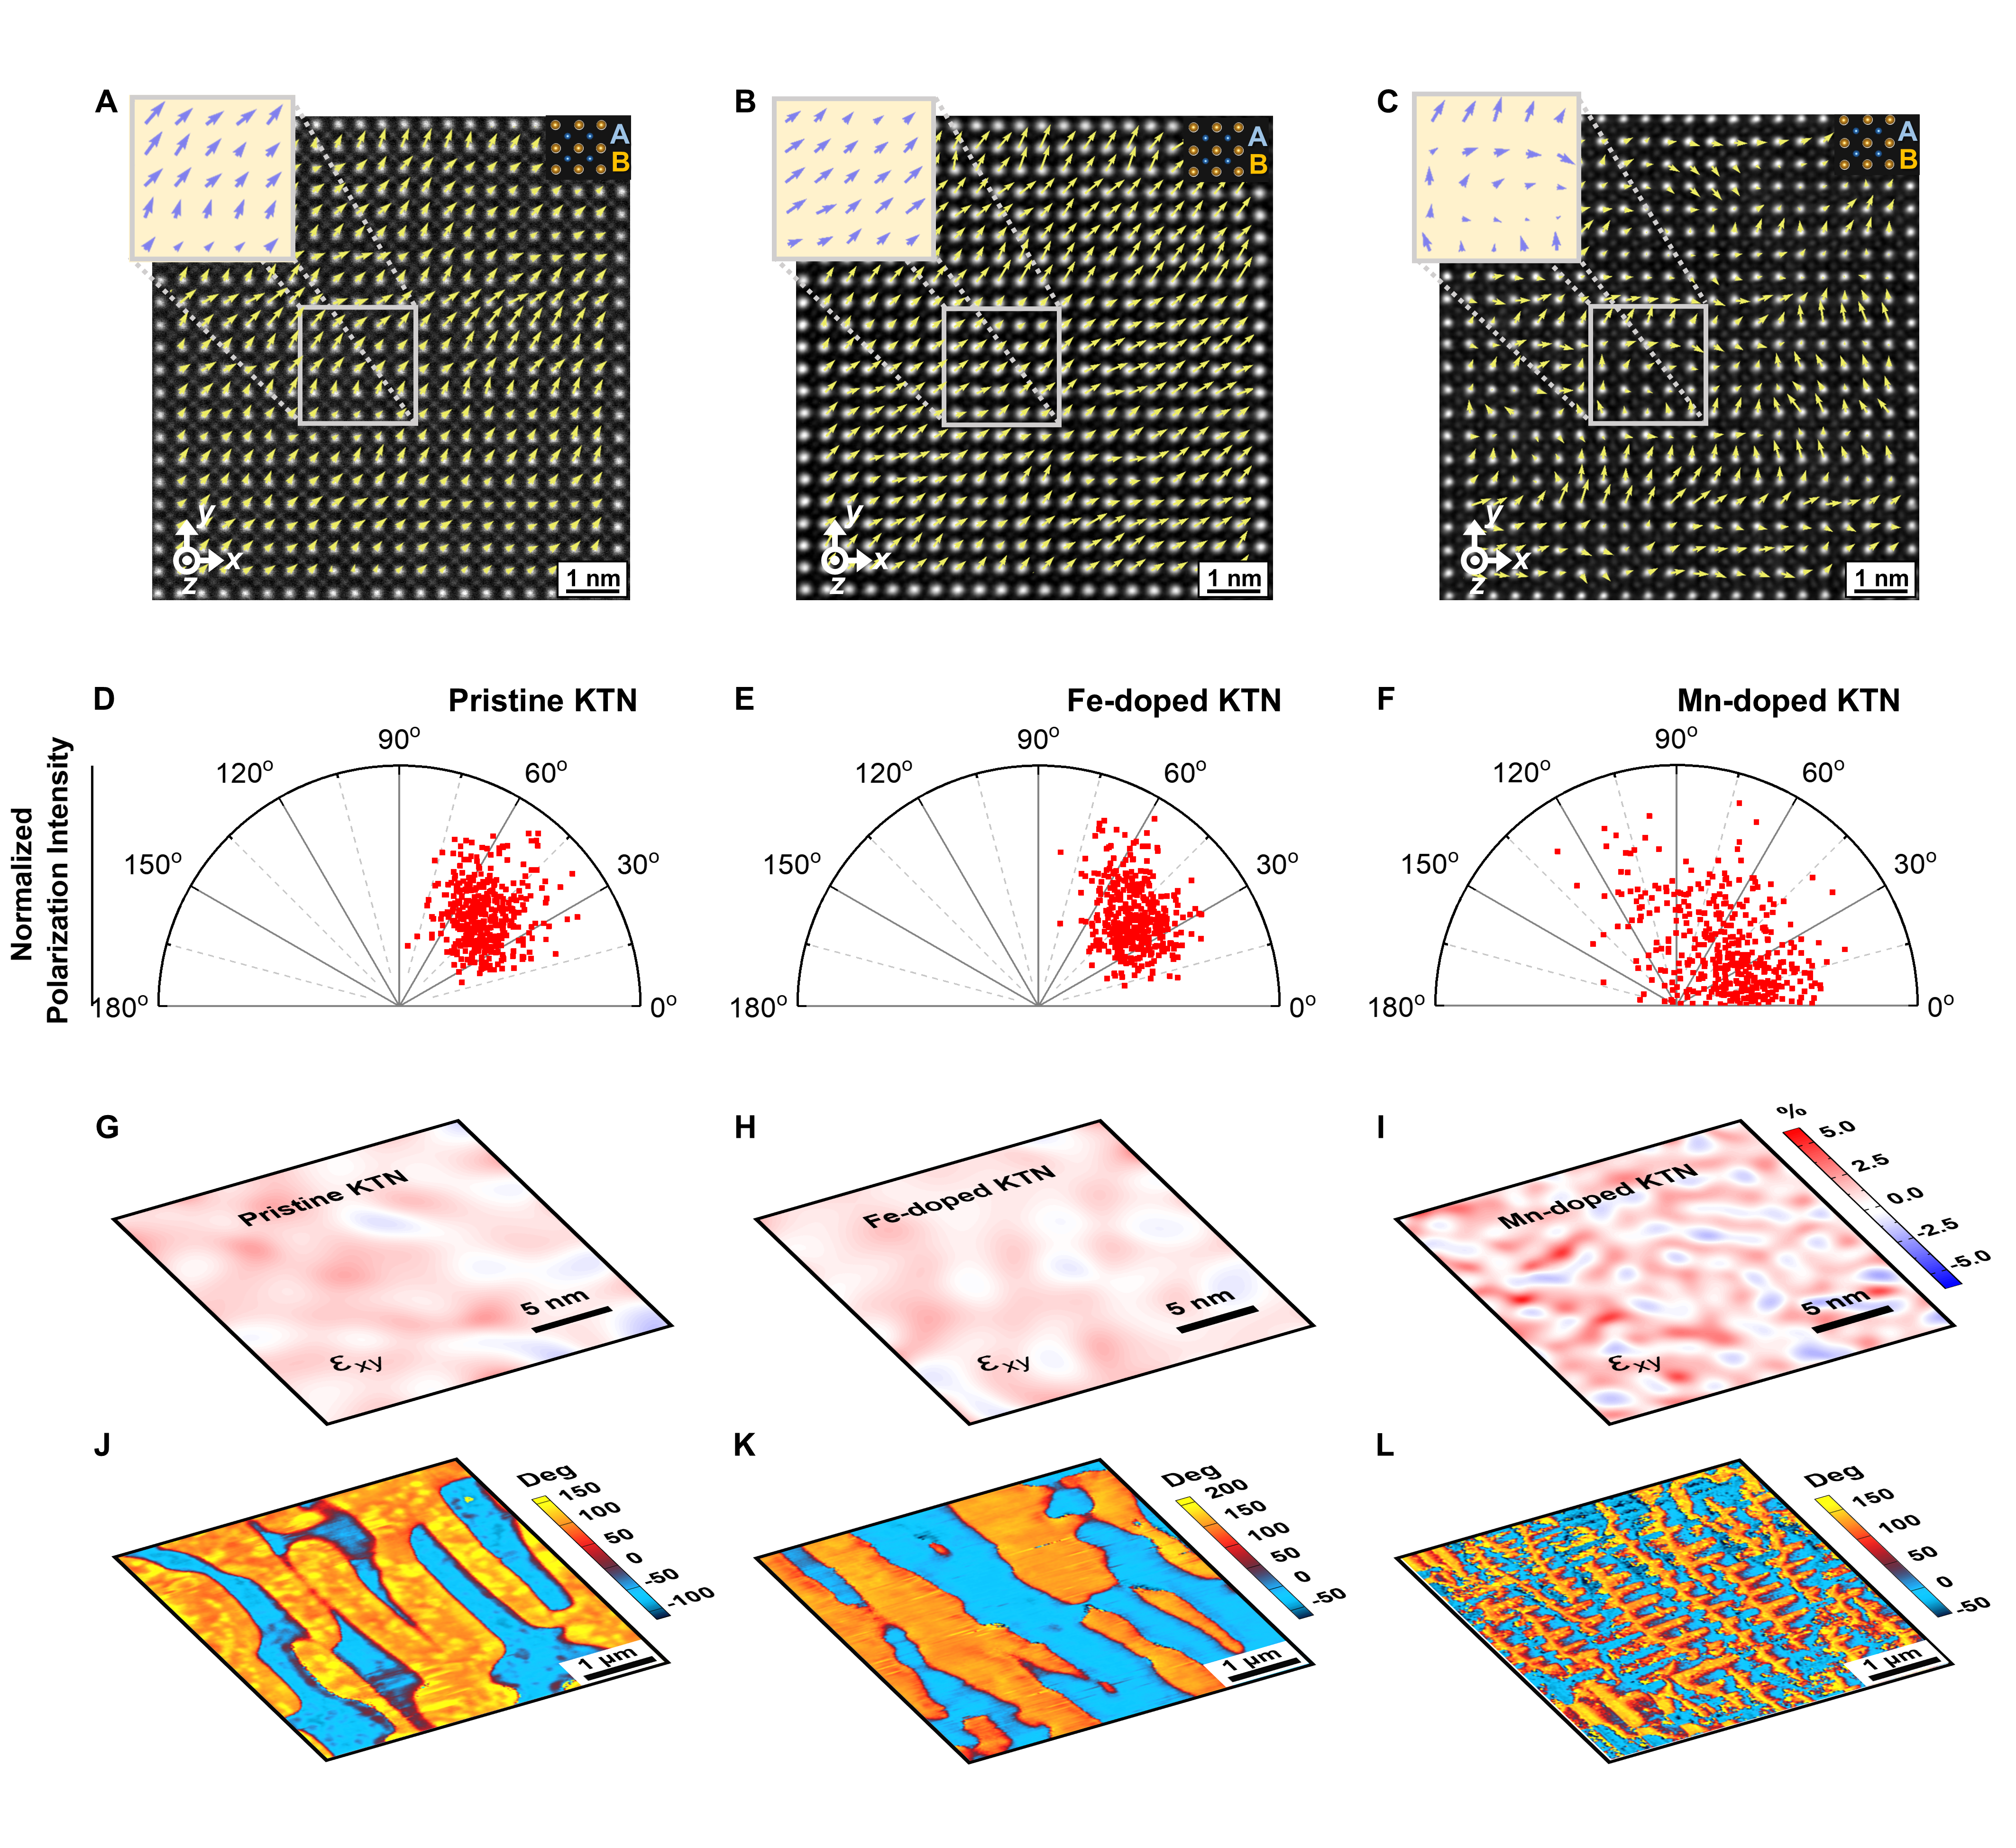
Fig. 2 | Local structures of the crystals. A–C The high-angle annular dark-field (HAADF) images of the pristine, Fe-doped, and Mn-doped KTN crystals, obtained along the [001]C direction at room temperature, respectively. The small and large bright points represent the A-site and B-site ions, respectively. Mappings of the polar vectors are marked by yellow arrows in (A–C). The atomic displacements are presented as vectors pointing from the center of a B-site cation to the center of its four nearest neighboring A-site cations. These atomic displacements represent the magnitudes and directions of the polar vectors for each unit-cell column. The x, y, and z directions correspond to the [100]C, [010]C, and [001]C crystallographic directions, respectively. The statistical scatterplots of the absolute value of the angle between the polar vector and the x-axis are shown in (D–F) for pristine, Fe-doped, and Mn-doped samples, respectively. G–I Distributions of shear strain εxy and J–L phase of piezoresponse force microscopy (PFM) images on the (001)C faces of the pristine, Fe-doped, and Mn-doped samples, respectively.